In the first post related to the IoT platform we talked about some introductory aspects:
- The importance of using an IoT platform for disaster prediction, showing a real project for monitoring the structure of bridges and tunnels (NTSG partner)
- The meaning of IoT data storm (how much data are we talking about)
- That importance of choosing an appropriate IoT platform and an experienced service provider before starting an IoT project.
In this and future posts, we will describe many aspects of the IoT world and how the GV IoT platform addresses them, using as a real scenario for the discussion a project for monitoring the structural deformations of a highway tunnel subject to landslides. This scenario will be used as the background to the narration for all GV IoT platform posts.
To simplify the exposition of the GV IoT platform, in terms of what it is and how it addresses some of the top IoT issues (amount of data to elaborate, security, scalability, storage and analytics), we will describe the trip of a single measurement from Things to Humans and the back trip of a command from Humans to Things.


We now begin describing the monitoring scenario and immediately after we will begin the narration from the Thing, the real protagonist of this story.
The scenarios that will be used during the trip into the GV IoT platform
Reference scenario: Monitoring structural deformation of a tunnel

The scenario consists in monitoring the health of a tunnel, in term of structural deformations that may damage the tunnel itself and put Humans in danger.
Natural causes that affect the structure of a tunnel:
- Landslides
- Earthquakes
- Wind
- Infiltrations
- Temperature
- Etc.
Human causes that affect the structure of a tunnel:
- Traffic
- Heavy vehicles
- Accidents
- Etc.
But how do you actually prepare a tunnel to be monitored for deformations?
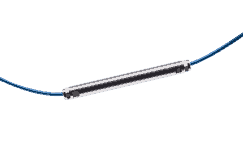
We can use a FS22 Industrial BraggMETER (picture 1) and wire the entire tunnel with the fiber cable (picture 2) and strain sensors (picture 3).
Source: NTSG Val di Sambro: “3 lines of sensors have been installed along the whole tunnel, while the thermal sensors have been installed at distances previously set. This to compensate the effects, on the readings, of thermal variations and to obtain a pure mechanical deformation. It is possible to control the longitudinal movements of the tunnel, and verify if the tunnel keeps the initial shape as designed.”
- Number of sensors: 780
- Sampling rate: 10 Hz
- Wiring: 30 km of optical fiber
- Packet dimension: 6 bytes (single sensor) - 30 bytes header for all
- PLE: 4 (working platform, lifting)
- Working time: 24/24h, 365d/year
We have:
- 780 sensors * 10 Hz * 10 bytes * 60 seconds * 60 minutes * 24 hours
- ~46 Kb per second
- 161,7 MB per hour
- 3,78 GB per day
- 10 messages (~4,6 kb each message) per second to send over the internet
Many information about the IoT technology can be found here: https://www.hbm.com/en.

(1) FS22: Industrial BraggMETER |

(2) Fibre cable: can be very long |

(3) Strain sensor |

(4) BraggMONITOR application |

(5) BraggMONITOR application |

(6) Other sensors |
The picture 4 of the BraggMONITOR application (window application that connects via LAN to the Industrial BraggMETER) shows all strain sensors that start from the Industrial BraggMETER, that in this case has four fiber cables doors.
|

(7) The tunnel from one of the working platform (PLE)
|

(8) The FS22 + switches
|

(9) The fibre cable
|

(10) Wiring elements
|

(11) Switch + wiring elements
|

(12) Wiring elements
|
The trip from Things to Humans: sensed data and analytics

The story begins with a strain sensor SS01 at t1 that is measuring a wavelength of 1572.52 nm (nanometer = one billionth of a meter). Actually, it is not just that sensor that is measuring the wavelength, but all 780 sensors at a common frequency of 10 Hz.
 |
At 2018-Set-10 10:10:20.1 (.1 = 1/10 of a sec)
Wavelength = 1572.52 nm |
Here are some initial questions to answer if you want to use the BraggMETER:
- How can we read this importation out of the BraggMETER?
- How is the information coded? Binary, ASCII?
- Can we read a single value at a time or can we read in continuous mode (at 10 Hz)?
- Do I need a special communication protocol to use the BraggMETER?
- etc.
Fortunately, the BraggMETER has an ethernet door and a user manual that can be retrieved here:
To make this story short, here are the answers:
- If you open a socket with the command port and send a particular command to it, the BraggMETER can send pieces of information back to you in continuous mode on another port. You can also decide if you want the information in binary or ASCII mode
- The FS22 talks the “skippy” language:
- Each package (binary in this example) that you receive has a header of 30 bytes and 6 bytes for each sensor. In total (780 sensors * 6 bytes) + 30 bytes = 4710 bytes
The output of the BraggMETER (every 1/10 of sec = 10 Hz):
- “<header><ch0:s1>,1572.52,...,<ch0:sn>,...,<ch3:s1>,<ch3:s2>,...,<ch3:sn>”
Conclusions
The first part of our journey ends here.
In the following Blog post, we will see the data leave the sensor and travel in all its phases up to the view from the human being.
If you want to deepen some topics do not hesitate to leave us a comment below, just to let us know your opinion.


